
A recent Industry Dive survey found that nearly 50% of manufacturers face challenges in the automation project planning. In large manufacturing environments, opportunities to automate often outnumber the time and resources available to size them. Setting up realistic automation targets and identifying a pool of opportunities through factory walks are a good starting point. The next step is turning the data and observations into an automation transformation portfolio to create an objective framework for capital allocation.
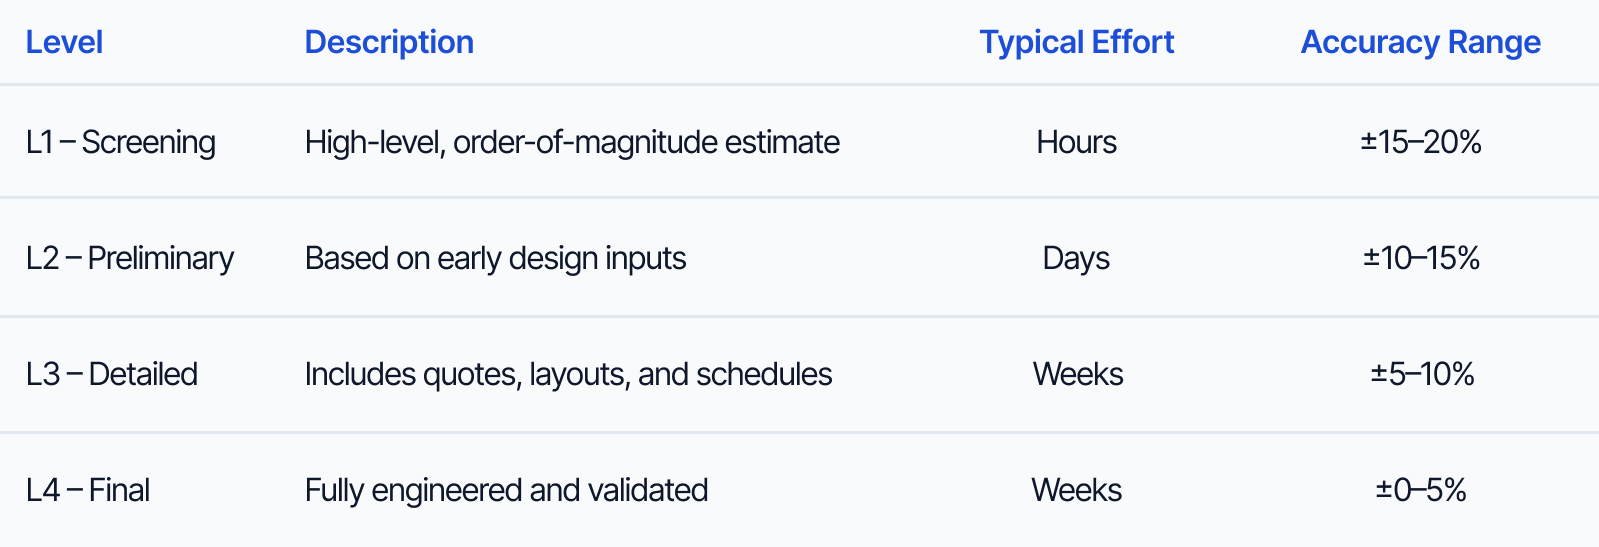
This is where Level 1 (L1), or order-of-magnitude assessment, becomes essential. It creates early, defensible inputs for CAPEX, labor impact, and payback, allowing automation leaders to prioritize opportunities and allocate capital effectively.
Project Sizing:Getting to L1 Estimate
Most automation projects start with estimating the CAPEX, but not all estimates serve the same purpose, nor are they necessary at every stage in the planning process. The distinction is especially important as more precise estimates generally require greater commitment in terms of engineering hours. To put this in context, the Association for the Advancement of Cost Engineering expects the final engineering estimate to consume the majority of estimation efforts, often exceeding 70% of the total efforts. An L1 estimate prevents allocating greater time to opportunities that may not move the needle.
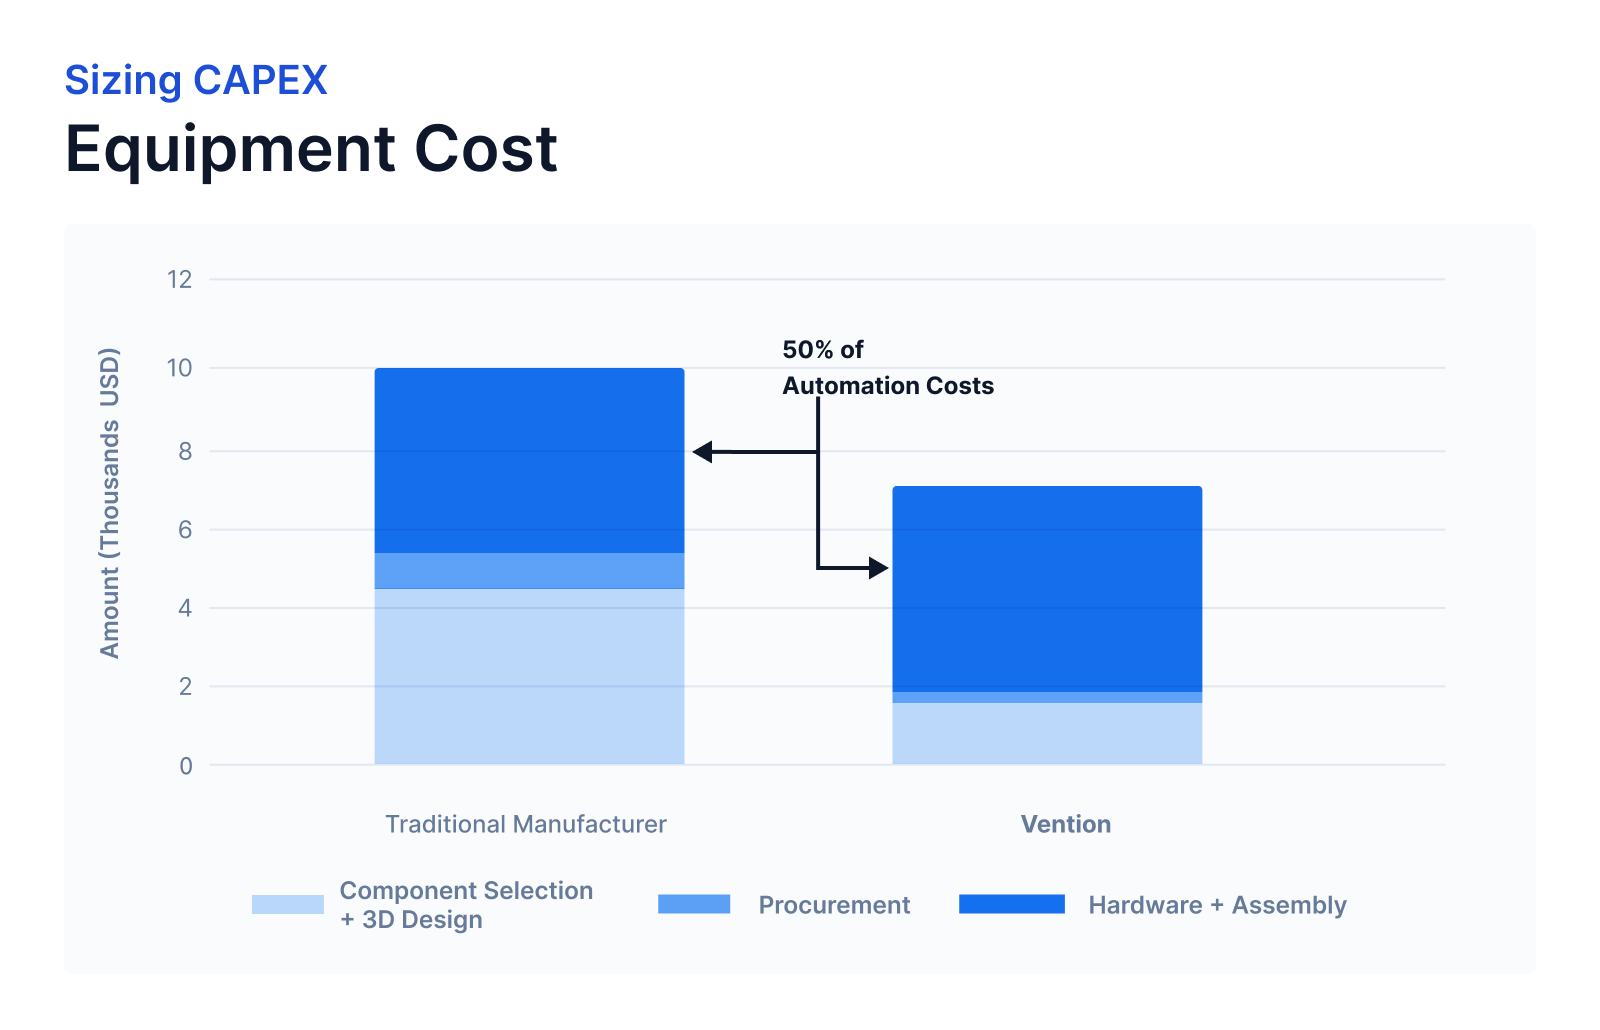
Sizing CAPEX: Equipment Cost
Traditionally, automation equipment costs represent at least 50% of total project costs, which offers a good base to start sizing automation initiatives. For most industrial automation equipment, manufacturer pricing can be safely estimated within 20-30% of the eventual cost. A palletizing system is the perfect example to understand the estimation accuracy. At the entry level, a cobot palletizer cell starts at around $100K. When the application requires higher payloads, longer reach, increased throughput, or more complex integration, the same system usually falls in the $140K to $150K range.
Factory walk observations, such as guarding requirements, material flow, and site constraints, are typically sufficient for narrowing the estimate to within 15–20% of final cost without vendor quotes or detailed engineering.
Common Automation System Price Range Including Products and Services (North America, 2024-2025)

Calculating L1 Estimates for Economic Value
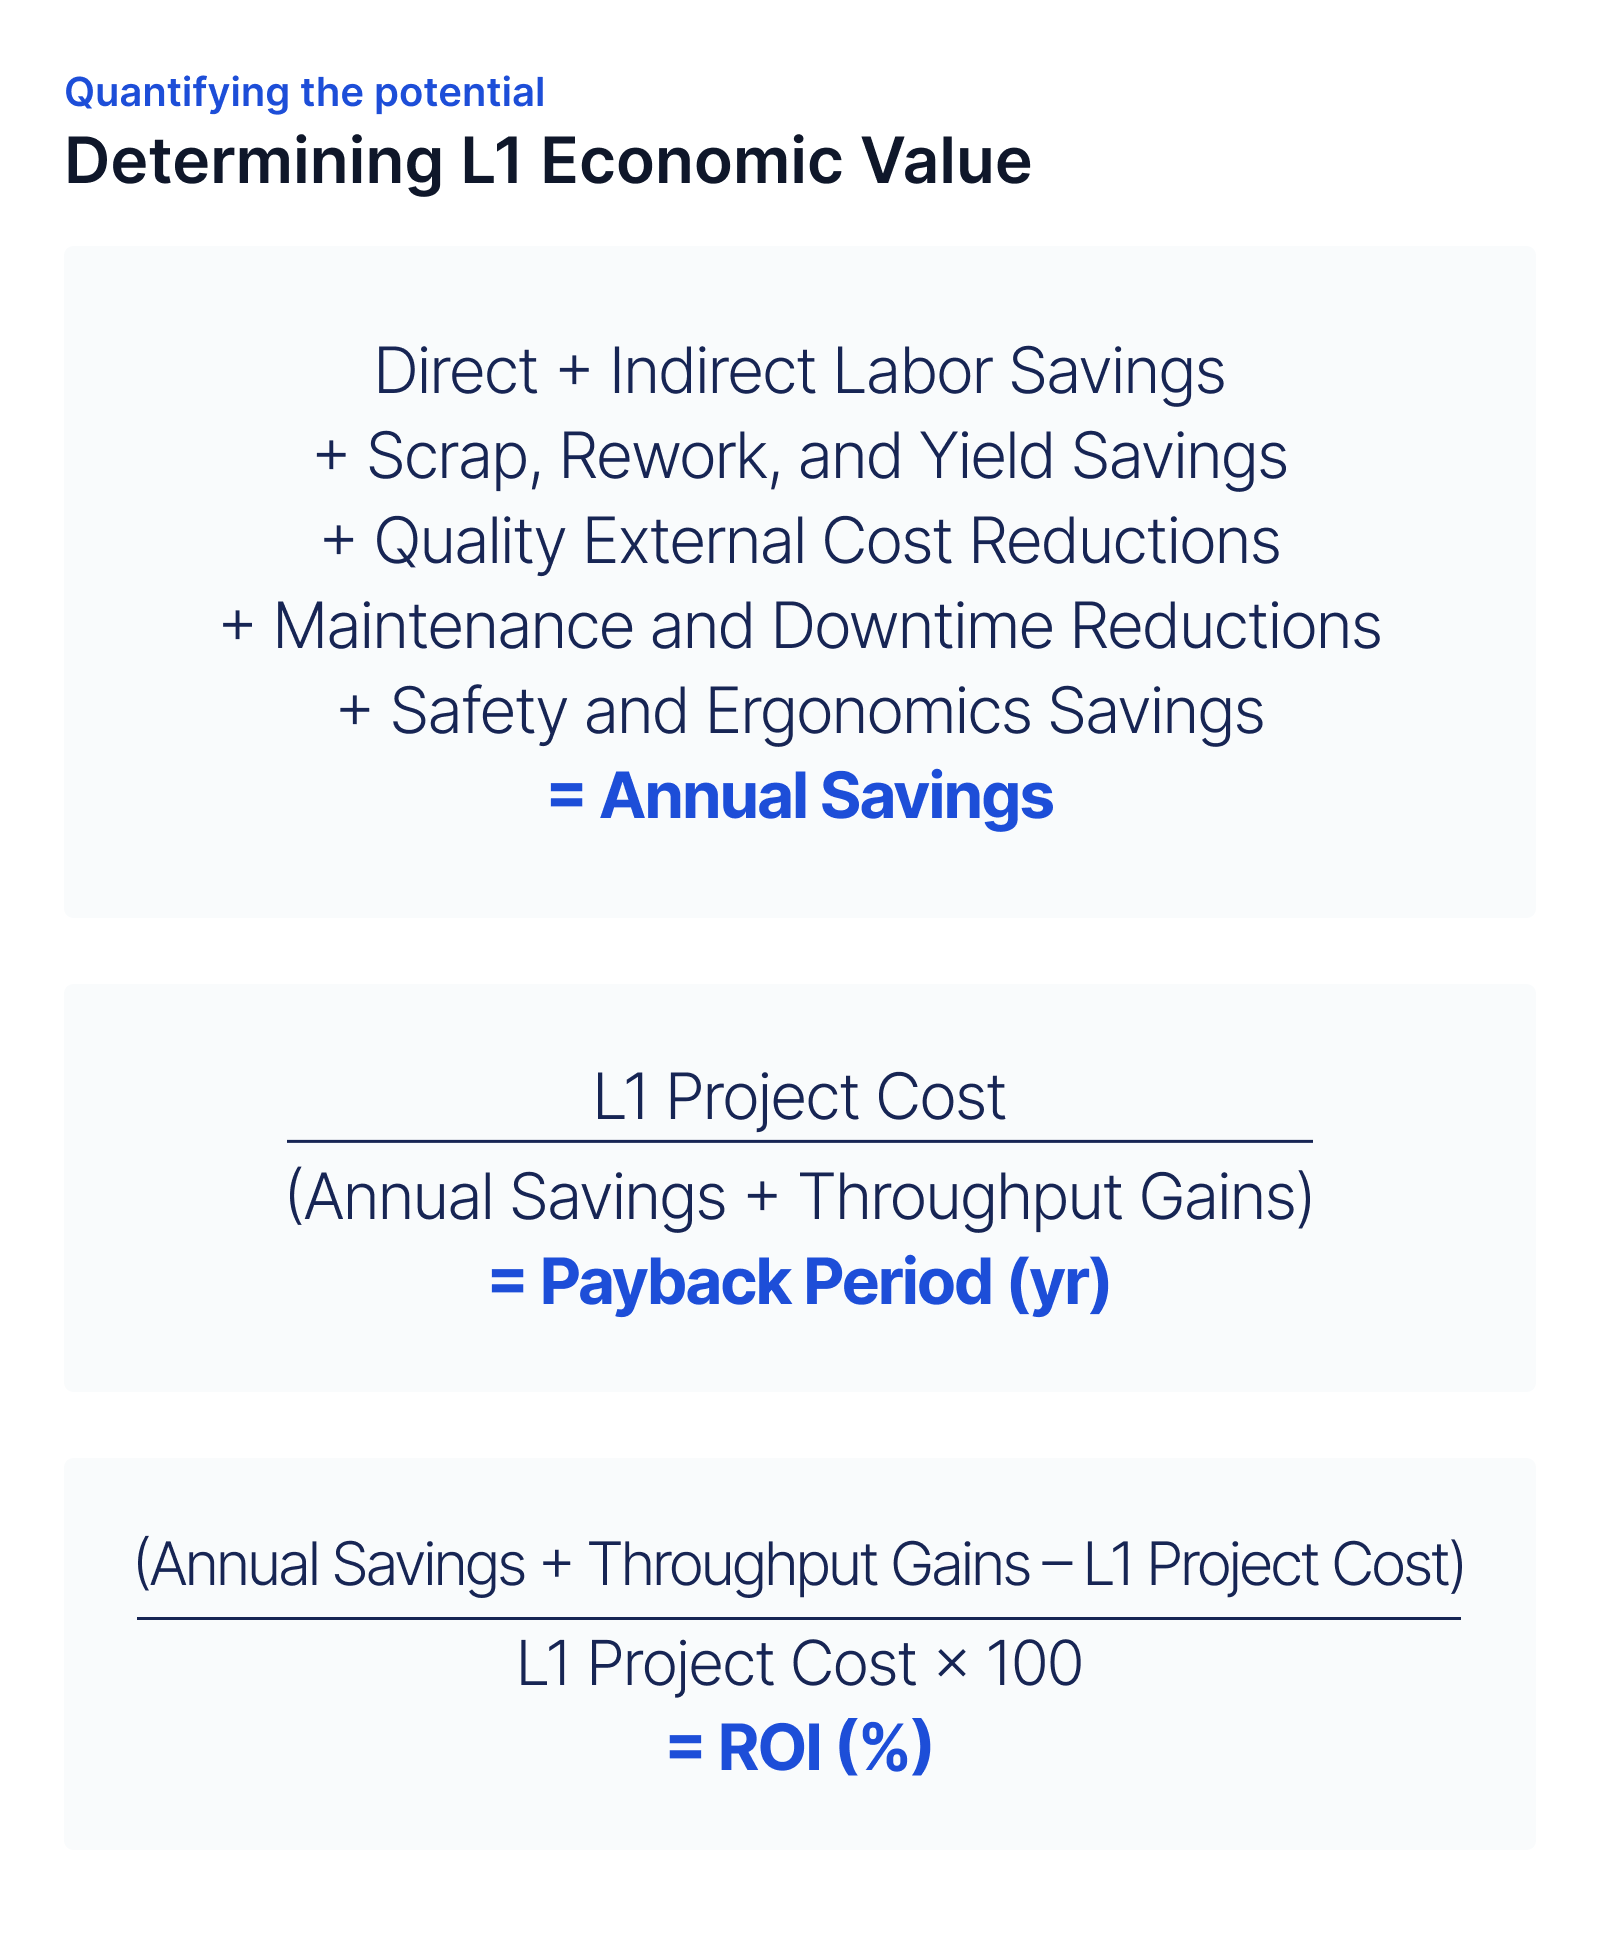
Once a high-level CAPEX estimate is defined, the next step is determining the economic value of automation. Labor reallocation usually provides the clearest path to ROI, but it is only one part of the total benefit. Other key inputs such as injury data, scrap and rework levels, downtime, and throughput constraints are also captured during the factory walk stage and can contribute meaningfully to the overall economic value.
Calculating Annual Savings, Payback, and ROI
At the L1 level, annual savings can be expressed as a combination of several value drivers. Throughput gains can be added when increased capacity generates incremental contribution margin.
Regional variance can also influence the analysis. For example, an operator may cost around 40,000 dollars annually in Tennessee and closer to 70,000 dollars in Oregon. Including these differences improves the accuracy of early-stage estimates.
Once L1 CAPEX and economic value calculations are complete, teams can consolidate results into a portfolio to evaluate the total automation transformation opportunity across multiple factory sites.
Creating an Automation Transformation Portfolio
Once each opportunity is sized at the L1 level and paired with an early economic view, the work shifts from estimating individual projects to comparing them as a portfolio. This is where capital planning moves from a list of possibilities to a structured model for decision making.
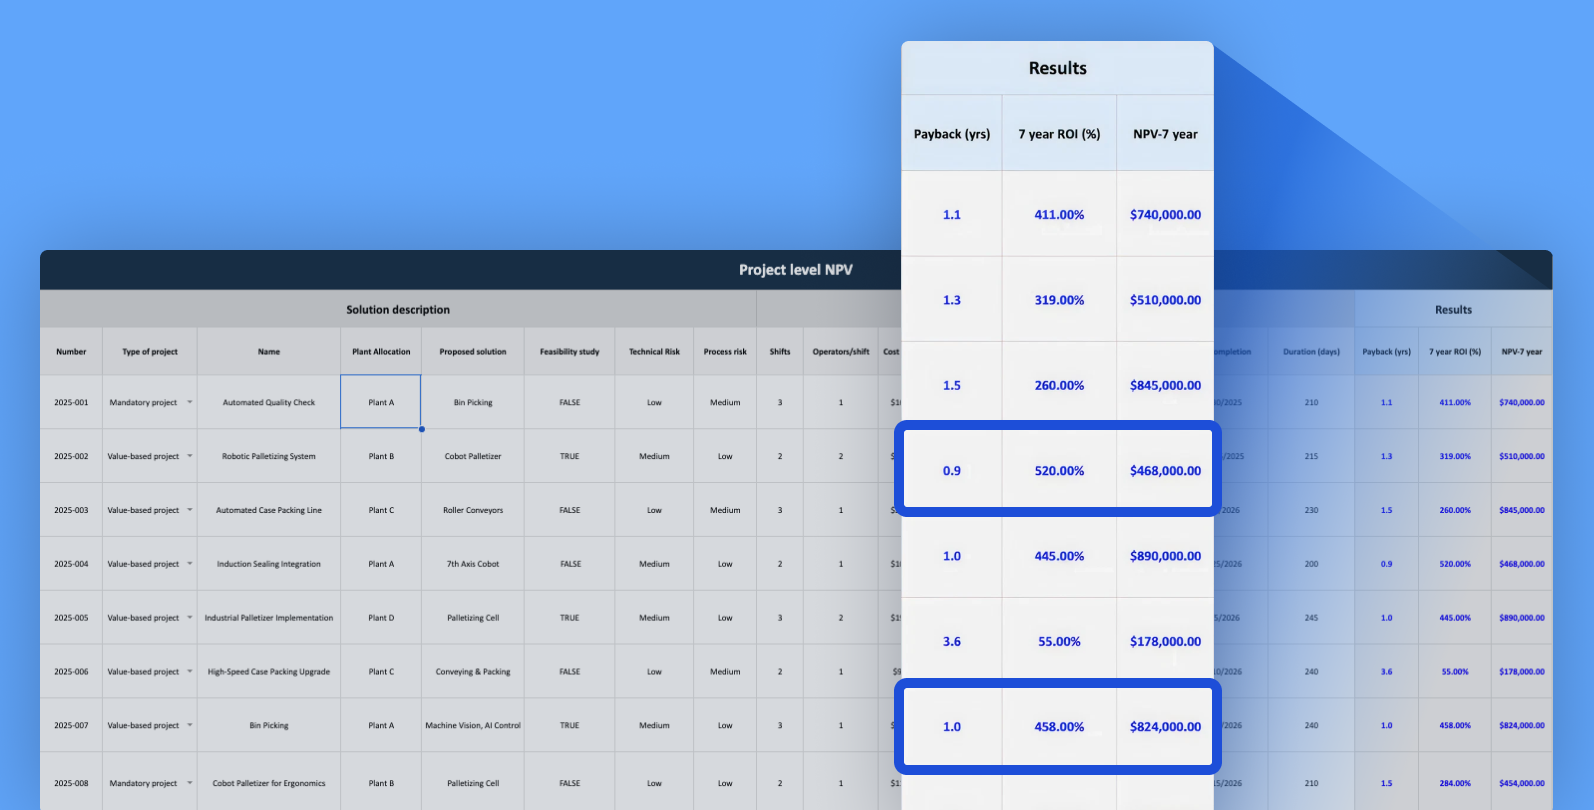
At this stage, every project is defined by a small set of consistent factors such as:
- Project type: Mandatory (safety/compliance) or value-driven (ROI-based)
- Automation category: Palletizing, case packing, machine tending, etc.
- L1 CAPEX estimate: Equipment, installation, integration
- Execution complexity: Low/medium/high based on site constraints
- Lead time & payback: How soon can the automation system be deployed and generate ROI
- Labor impact: Current opex based on the number of operators, shifts, and regional payscales
- Risk factors: Technical maturity, vendor availability, operational disruption
These inputs are enough to create an ‘Enterprise Automation Roadmap’ and calculate Net Present Value (NPV) for automation. The result is a portfolio of 15 to 30 quantified opportunities, which can now be compared and prioritized based on their payback based on NPV, risk, and strategic fit.
Conclusion
A quantified opportunity portfolio is not the finish line; It is the foundation for automation transformation. With CAPEX, labor value, payback, and risk now expressed in comparable terms, automation leaders can move into building a roadmap that meets their objectives and increases profitability.
Building an automation roadmap? Get in touch with Vention experts for resources and insights.
