As industrial automation is becoming increasingly accessible to all manufacturers, calculating return on investment (ROI) for such projects is becoming increasingly prevalent. If you’re just getting started with automation, there are additional factors beyond ROI to consider. Check out our “Getting Started with Automation” blog post for a how-to-guide on transitioning into automation.
Within industrial automation, many factors can impact ROI, and with the rise of the Manufacturing Automation Platform (MAP), companies have seen strong ROI on an increasingly large portfolio of automation projects. The seamless integration of software and hardware under MAP allows automation practitioners to achieve more with less, resulting in ROI under one year for most projects completed on MAP.
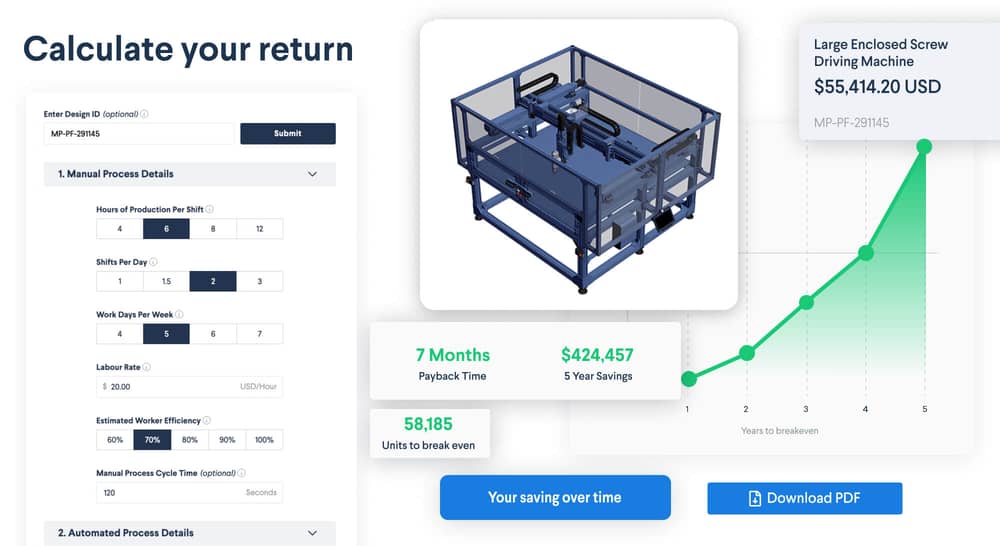
With all the factors that go into a single project, calculating ROI can become fairly complex. To empower manufacturers in calculating ROI, we’ve created a simple ROI calculator that requires only nine inputs and provides an accurate response in just a few clicks.
In this article, you will learn:
- MAPs impact on equipment cost
- MAPs four distinct sources of cost saving
- How ROI is calculated for industrial automation
- How to use the ROI calculator
How the Manufacturing Automation Platform impacts equipment cost:
The Manufacturing Automation Platform (MAP) pushes the traditional boundaries of automation, encompassing the entire workflow of industrial automation projects from design, automate, order, and deploy. In every step of your project, witness the seamless integration between these phases as each is tied together through a single digital thread.
The close integration leads to reduced labor costs and shortened project timelines so manufacturers can automate 3x faster and with up to 40% less non-recurring engineering costs. Because MAP is primarily intended for high-mix, low-volume factories, it’s no surprise that it offers a strong payback, even at lower production volumes.
MAP provides four distinct sources of cost savings:
Savings in the Design phase
MAP’s first step is MachineBuilder, a 3D design environment tailored for simple modular automation components. Unlike traditional 3D CAD software that emphasizes on designing custom components for future manufacturing, MAP enables users to skip this process and work with pre-configured components with guaranteed compatibility. Design tasks are further accelerated by smart design features such as automatic part connections, component configurations, automatic design checkers, and more.
Using MAP instead of traditional 3D CAD software has resulted in an 8–10x reduction in engineering hours in the design phase alone.
Savings in the Automate phase
Historically, programming industrial equipment required specialized knowledge of the PLC programming language, making the automation phase costly for any project. However, with MAP, the process of creating and simulating automated programs has been streamlined. Through MachineLogic, our code-free programming environment, any manufacturing professional can accomplish this task in just a few hours, significantly reducing the time and effort required.
Benchmarking studies confirm a 3x improvement in programming time and an approximate 40% reduction in system integration cost vs the traditional industrial automation approach.
Savings in the Order phase
Purchasing all the required components for automated equipment can be a job of its own. Given the need to request quotes, send purchase orders, and consolidate parts from various vendors (machined parts, raw sheet metal, and original equipment manufacturer (OEM) products), administrative work related to purchasing and invoice management can consume up to 15% of project time.
Unlike traditional procurement software, MAP provides an integrated design and ordering environment through MachinePortal. This platform eliminates most of the usual procurement activities and simplifies the process into an intuitive e-commerce experience. Designers can order equipment instead of company buyers, eliminating back-and-forth communications, shortening lead time, and requiring less human interface. Additionally, MAP automatically generates the bill of materials, provides real-time order tracking, and offers a one-stop-shop purchasing platform for all project components.
Savings in the Deploy phase
Traditionally, deploying automated equipment is a time-consuming and complicated process where unresolved compatibility issues, leap-of-faith design choices, and overlooked laws of physics typically reveal themselves. With MAP’s smart design tools and simulation validation, these issues are largely eliminated by the time your machine is ready to be deployed.
By leveraging the digital twin data of the machine already present in MAP, MachineCloud enables users to successfully deploy automation equipment from the cloud to the factory floor in minutes. This streamlined process leads to low-cost deployment because it is completed directly by the end user with pre-tested and plug & play components.
Components of the ROI model for automated equipment:
The savings from MAPs will primarily impact equipment costs. In our observations, total equipment savings (vs. the traditional approach) often exceeds 40%. The more complex the equipment, the greater the potential savings. These equipment savings often reduce the payback period to less than a year.
However, any comprehensive ROI evaluation must consider factors beyond equipment cost. The most useful ROI calculation models will offset equipment cost against three sources of value: (1) process cost savings, (2) labor cost savings, and (3) incremental production volume.
- Process cost savings tend to materialize in the form of low-cost quality. Repeatable automated processes reduce defects and consumable usage, resulting in cost savings. For example, in manufacturing operations like drilling or deburring, a more repeatable process will lead to fewer parts being rejected or needing re-work. Overall, automation significantly reduces process costs by improving quality and efficiency.
- Labor cost savings are easily quantifiable by simply considering the salary cost of current operators being replaced. That said, factoring in operating human efficiency (OHE) and operating equipment efficiency (OEE) will greatly improve the result accuracy. Due to factors such as breaks for humans and setup/maintenance for machines, consistent operation for a full 8-hour shift is not achievable. On average, we see OHE ranging around 80%, while OEE ranging at 90%.
- If the implementation of automated equipment reduces cycle time in comparison to manual processes, it is essential to incorporate the potential revenue generated from increased production. However, caution is needed for market acceptance and pricing of additional supply. Alternatively, treat these gains as intangible benefits without assigning a specific numerical value if a conservative approach is preferred.
In addition, manufacturers should consider operational safety and difficulty in recruiting when calculating ROI on their next project. The addition of automation can largely increase safety by moving employees off manual, labor-intensive tasks. This helps mitigate the likelihood of costly incidents that could adversely impact the project’s profitability. Amidst the current labor shortage, finding and attracting top talent with the necessary expertise and experience can be a demanding and time-consuming endeavor. This difficulty in talent acquisition can have repercussions on project timelines, productivity, and overall ROI.
By considering operational safety and recruitment in addition to the three factors outlined above, manufacturers can make more informed decisions about their project’s potential returns.
Using the Vention industrial automation ROI calculator:
Calculate the ROI on your next automation project in just a few clicks with our ROI calculator.
**1. Access the ROI calculator [here]
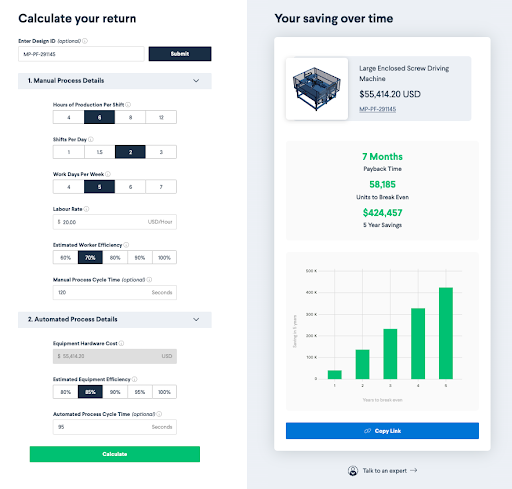
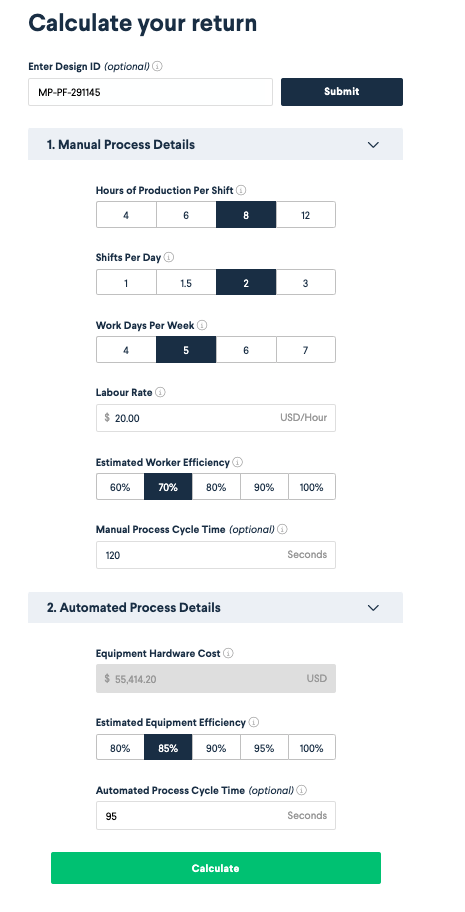
2. Enter your Design ID, and your equipment hardware cost will automatically populate. If you do not have a Design ID, you’ll enter that information manually later on.

3. Enter your Manual Process Details and Automated Process Details.

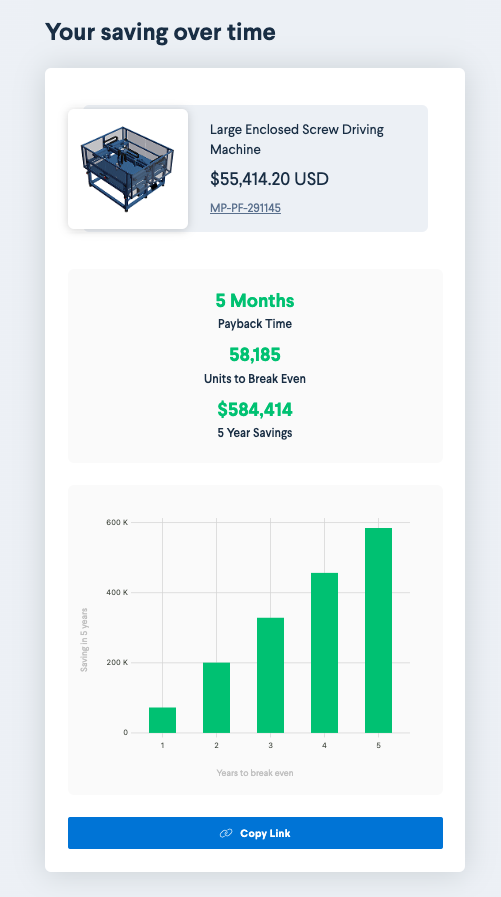
5. Click Calculate. Your savings will populate, showing your estimated payback time, units to break even, and total savings after five years. You can easily share this information—just copy the link and send it to your team!

Calculating ROI on your next industrial automation project is that easy. Try it out for yourself today.
